The Third Gift Is the Whole Ballgame
By RaiseTell Team ·
If you want to know how a donor relationship will turn out, you usually don't need to wait years to find out. The answer tends to reveal itself in the first few gifts — because those early gifts aren't just transactions. They're signals about a relationship that's still deciding what it will become. And the gap between a donor who crosses the third-gift line and one who stops short of it isn't incremental. In real files, it's enormous.
What one real file shows
Here are the actual numbers from one organization's donor file — a pattern we see again and again. Split the file by whether a donor reached three or more gifts or stopped at fewer than three, and look at what each group is worth over their lifetime.
Start with the everyday donors — those whose first year of giving fell below the top tier (the "Middle/Bottom" first-year segment), who make up the vast majority of any file. Note the split is by first-year segment, but the gift count is measured over the donor's whole lifetime:
| Lifetime giving | Reached 3+ gifts | Stopped before 3 | Multiple |
|---|---|---|---|
| Median | $627 | $52.50 | ~12× |
| 75th percentile | $2,311 | $100 | ~23× |
| Average | $9,893 | $195 | ~50× |
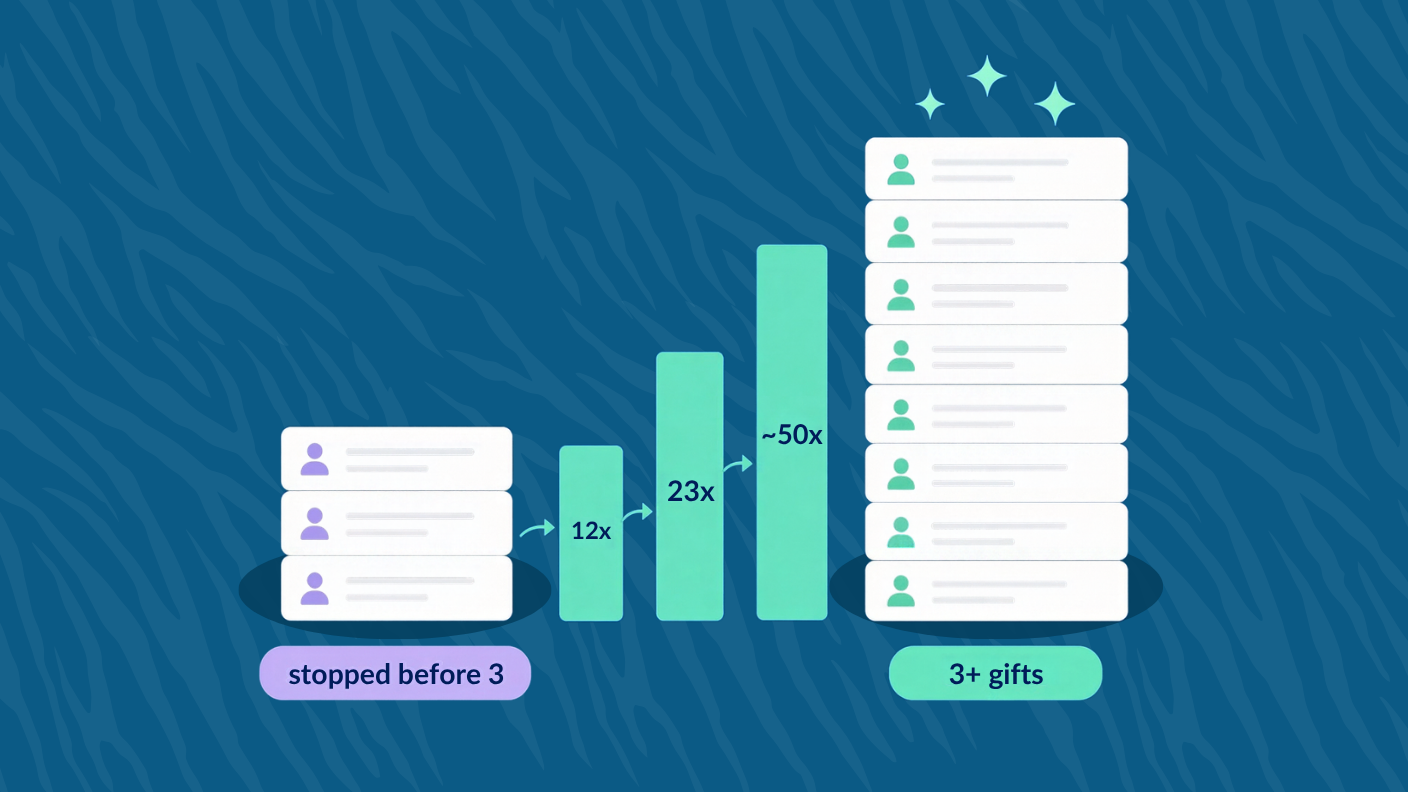
Read those three rows top to bottom, because that's the real story. A typical donor who reaches a third gift is worth about 12× the median of one who doesn't. Step up to the larger everyday donors — the 75th percentile — and the gap nearly doubles to ~23×. Across the full average, pulled up by the biggest givers, it's roughly 50×.
That progression is the point: the bigger the donor, the more a third gift multiplies them. The third gift matters for everyone, but it matters most for your larger donors — the very people a small development team most wants to hold onto.
We don't normally like to focus on averages because they can be skewed by outlier numbers (i.e., large gifts). However, these numbers are real, and because it's virtually impossible to determine which of your donors whose first gifts landed them in the bottom or mid-middle segment will turn into major donors down the road (but some will), we think looking at the average in this case is relevant.
It holds across every donor size
Let's look at the other end of the file: the donors whose first year put them in the top tier.
Even among those top donors, the third gift still creates a step-change. Top-tier donors who reached 3+ gifts averaged $413,429 in lifetime giving versus $67,953 for those who stopped short — about 6×. Smaller multiple than the everyday donors, but on a vastly larger base: the difference in REAL dollars between a $68K donor and a $413K one, decided in large part by whether the relationship reached its third gift, is huge.
Everyday donors, ~50× on average. Top donors, ~6× on a six-figure base. The third-gift effect runs through the entire file.
Why the early gifts carry so much signal
Why does the curve bend this hard, this early? Because a gift count is really a measure of identity, not just activity. A first gift can be an impulse — a friend asked, a story landed, a deadline loomed. A second gift says the first wasn't an accident. A third gift is a pattern, and patterns are how people come to see themselves. Somewhere around that third gift, a donor stops thinking "I gave to them once" and starts thinking "I'm a supporter." Everything about lifetime value follows from that shift — which is why the first three gifts are the highest-leverage window you will ever have with a donor.
The window you're structurally missing
Here's the problem, and it connects to everything in this series. Almost all of your tooling is pointed at the wrong end of the relationship. You wait for a donor to lapse, then run a report and try to win them back. But by the time a donor shows up on a lapsed donor report, the most valuable window — those first three gifts — is already behind them.
And the scale of the miss is staggering. In that same real file, 63% of all donors — 8,612 of them — never reached a third gift. Sixty-three percent, stalled at one or two gifts, sitting below the line that separates a $52 donor from a $627 one. Some gave once or twice and drifted off; a smaller, precious group are recent donors still early in the journey, one or two well-timed asks from crossing the line. Either way, they are the single largest pool of upside in the entire database — and the most valuable of them hide in plain sight. A donor who gave twice, recently, hasn't lapsed, so no lapse report flags them; but they haven't crossed the threshold either. By the time they'd surface on a lapsed report, the third-gift window is likely already behind them. The move is to catch them on the way up — not after they have lapsed.
From another report to a work queue
So the answer isn't another report. You don't need one more list of who lapsed. You need to know where to focus — which specific donors are sitting just short of the third-gift line, where your attention changes the outcome. That's not a report; it's a work queue.
Read the file for moments instead of absences, and the queue writes itself: the first-time donors who never came back and need a prompt, warm second-gift touch before they cool; the two-gift donors sitting one ask from the third; the recently recaptured donors who need a real welcome so the return sticks. Each line is a specific donor and a specific move — actions with names attached, and their giving history so far, not a metric to admire. Move even a modest slice of that 63% across the third-gift line and, at these multiples, it's worth more than almost anything else on your plate.
See the moment, know what to do
This is where the whole month comes together. Stop asking only "who stopped?" and start reading each donor for where they are and where they're headed — and the most valuable moments in your file stop hiding. That's the difference between a report and an analytic. A report tells you what already happened and hands you the departed. An analytic reads the file for the moments that still matter and tells you where to spend your limited time this week — while the window is still open.
This is exactly what RaiseTell is built to surface. It reads each donor's gift journey and hands you the work queue directly — who's approaching a second gift, who's one ask from the pivotal third, who just came back — so the 63% sitting below the line becomes a list your team can act on, not a pattern you discover in next year's analysis.
The third gift is the whole ballgame — and the multiples make it one of the most valuable lines in your file. The donors on the edge of it are already in your data, already telling you where to focus. The only question is whether you can see them in time to act.
This is just one opportunity missed by most nonprofits that RaiseTell was designed to surface.
If you've noticed RaiseTell's mascot Zeke, he is a zebra. Every zebra has different patterns to their stripes. Every nonprofit has different patterns in their data, and RaiseTell surfaces those patterns for you so that your team can focus on the biggest opportunities.
If you're wondering why no one does this already, the answer is they do. However, it's typically only the largest nonprofits with the teams, infrastructure, and resources to surface these kinds of patterns. RaiseTell's mission is to make that level of analytics available to anyone without technical complexity or high cost.
Reach out if you're interested in learning more.
Want to see who's sitting just short of the third gift?
RaiseTell reads each donor's gift journey and hands you the work queue directly — who's approaching a second gift, who's one ask from the pivotal third, who just came back.
Book a Demo