The Waterfall: The Whole Picture of Donor Movement
By RaiseTell Team ·
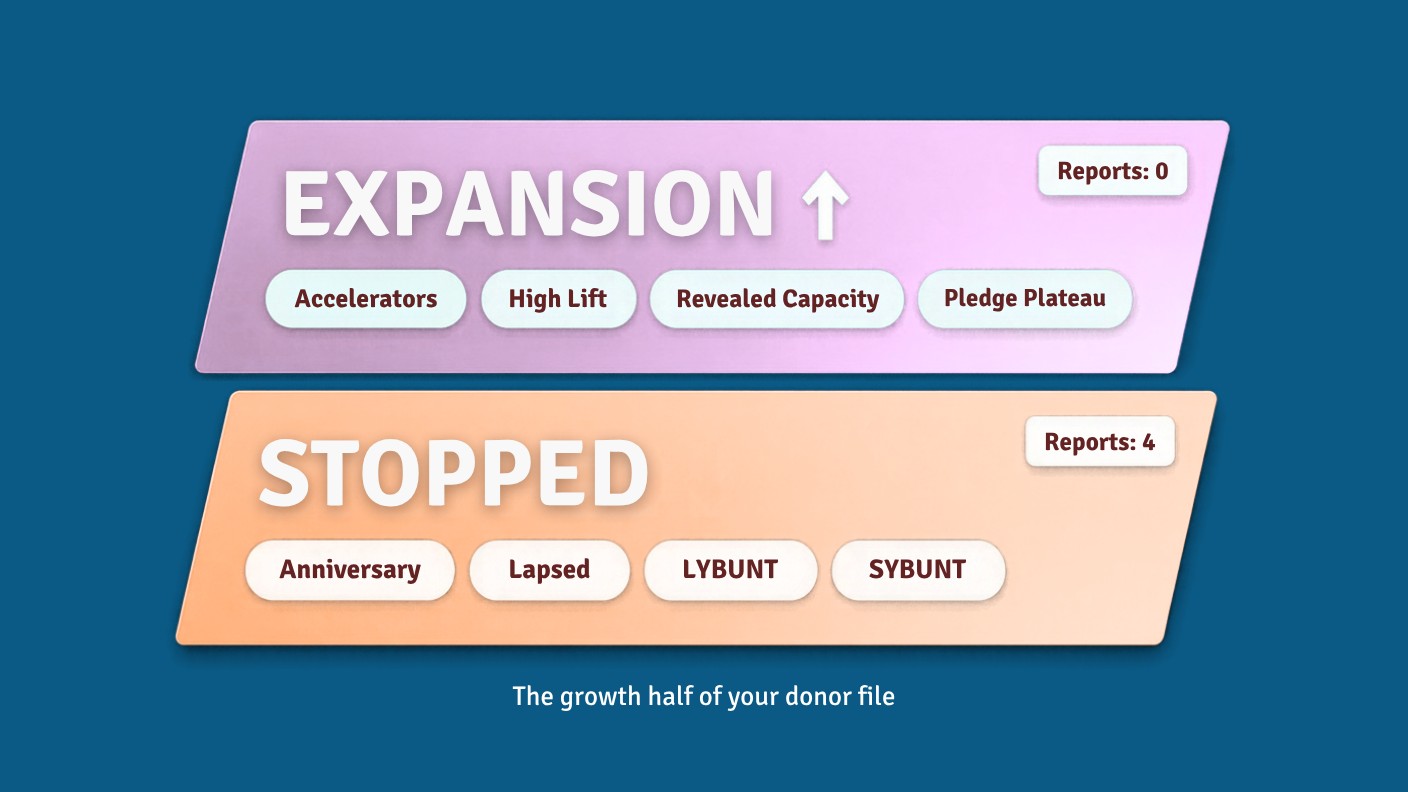
If you've been following along, you may have started to suspect that your four go-to reports — anniversary, lapsed, LYBUNT, SYBUNT — are only showing you a sliver of what's happening in your donor base. You're right. They all answer one question, who stopped giving, at four different intervals. Useful, but narrow.
We've spent the last few weeks on the signals those reports miss: the donors quietly changing, the ones a "retained" flag hides, the expansion happening on the upside, the pivotal third gift. All important. But it raises a bigger question: how do you get your head around the *overall* picture of movement in your donor base — everything, at once?
That's exactly what a revenue waterfall is for.
What a waterfall shows
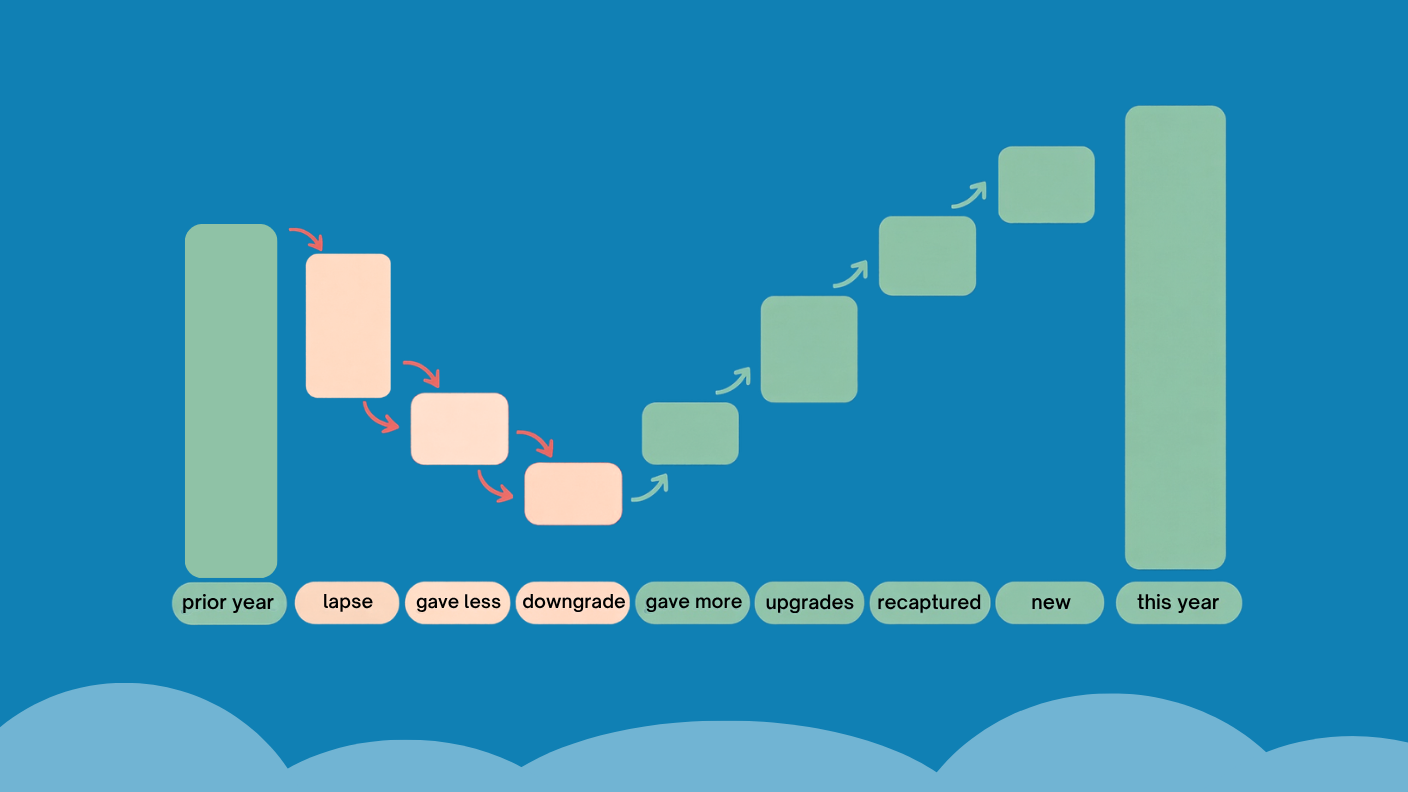
A revenue waterfall takes one segment of your donors and shows every dollar of movement between last year and this year, in a single picture. It starts with the segment's prior-year revenue, then walks through every way that number changed — down and up — until it lands on this year's revenue.
Every kind of movement gets its own step:
- The donors who stayed stable — same segment, steady giving.
- The donors who gave less but were retained — still in the segment, just smaller.
- The donors who gave so much less they dropped a segment — a downgrade out.
- The donors who gave more but stayed in the segment.
- The donors who gave enough more to move up a segment — an upgrade in.
- The donors who lapsed entirely.
- The donors you recaptured after a lapse.
- The new donors who arrived.
Every little bit of movement is shown visually — and a good waterfall lets you click into any box and see every donor who makes it up. It's not just a chart; it's the whole story of your year, with the names attached.
A real waterfall, and what it reveals
Here's the top segment of one organization's donor base, last full fiscal year. Watch what the waterfall surfaces that no single report would.
The segment started the year at $2.67M. Now, if you ran your Big Four, here's the part you'd see — and the part that would set off alarms: 13 of your top donors lapsed, taking $1.62M with them. That's a real and frightening number. Looking only at your loss reports, you'd conclude the top of your file was collapsing.
But that's a sliver. Here's what the waterfall shows alongside it:
- 11 top donors gave more and stayed on top: +$134K.
- 10 donors upgraded *into* the top segment — the single biggest move of the year: +$2.36M.
- 6 lapsed donors were recaptured: +$310K.
- 5 new donors arrived: +$220K.
- Against that: 8 donors gave less but stayed (−$67K), and 5 gave so much less they downgraded out (−$125K).
Add every box together and the top segment didn't collapse at all. It ended the year at $3.88M — up 45%. The lapse was real, but expansion, upgrades, recaptures, and new donors more than made up for it. You'd never know that from the Big Four. You'd have seen the $1.62M in red and missed the $3M in green.
Net revenue retention, made visible
This is the same idea we covered with net revenue retention — starting revenue, minus what you lost, plus what you grew — except now it's a picture instead of a formula. The waterfall makes the whole equation legible at a glance: you can see, in one view, whether your expansion is outrunning your lapse, and exactly which movements are driving the result.
That reframes the most important question a development leader asks — are we up or down this year, and why? — from a guess or a single scary metric into something you can actually see, box by box.
Every box is a worklist
Here's what makes the waterfall more than a pretty chart: because you can drill into any box and see the donors in it, every box is also a worklist.
- The 13 lapsed top donors are your highest-value win-back list — nothing else on your desk is worth more.
- The 8 who gave less but stayed are a check-in list, before a small slide becomes a big one.
- The 10 who upgraded in need real stewardship, so this year's gain doesn't become next year's lapse.
- The 6 recaptured donors need a genuine welcome back so the return sticks.
The waterfall tells you what happened; drilling into the boxes tells you what to do this week. That's the whole point of the series — turning a picture of movement into a set of actions with names attached.
The whole campaign, in one view
Step back and the waterfall is where everything we've talked about comes together. Who's changing? — it's every box. Retained doesn't mean healthy — that's the "gave less but retained" step. Expansion — the increases and the upgrades in. The third gift and the major pipeline — the donors climbing from one segment to the next. Five weeks of individual signals, assembled into one honest picture of how your donor base actually moved.
And it does what the Big Four never can: it shows you the losses and the gains, the contraction and the expansion, side by side — so you're not reacting to half the story.
Seeing your whole picture
This is what RaiseTell's waterfall is built to do. It reads the giving you already have and lays out every dollar of movement — segment by segment, box by box — with each box drillable down to the individual donors who make it up. Instead of four reports that each show a sliver, you get one picture of the whole year, and a worklist behind every part of it.
Your Big Four aren't wrong. They're just small. When you're ready to see the entire picture of movement in your donor base — and act on all of it — the waterfall is how you do it.
Want to see your donor base's full picture of movement?
RaiseTell lays out every dollar of movement in your donor base — segment by segment, box by box — each drillable down to the individual donors behind it.
Download the guide